 python
How to Append a Column to a DataFrame in…
In this short tutorial, you will learn how to append a column to a dataframe in Pandas.
Append a Column to Pandas Dataframe
In the first example, you are going to simply add a new column to a Pandas dataframe. Now, to add a new column to an existing Pandas dataframe, you will assign the new column values to the DataFrame, indexed using the new column name. However, before we go to the first append a colum nexample, here’s the basic syntax to add a column to a dataframe:
df['NewColumnName'] = values_in_column
Sometimes, when working with Python, you need get a list of all the installed Python packages.
Add a Column to Dataframe in Pandas Example 1:
Now, in this section you will get the first working example on how to append a column to a dataframe in Python. First, however, you need to import pandas as pd and create a dataframe:
import pandas as pd

df = pd.DataFrame([1,2,3], index = [2,3,4])
df.head()
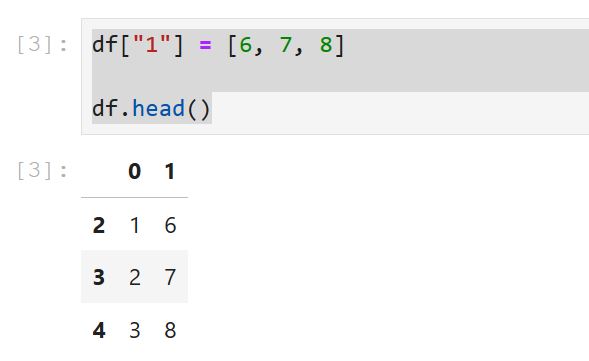
Next step is to add a column to the dataframe with the specified list as column values. Note, it is very important, here, that you have a list (or NumPy array) that is equal the number of rows in the existing dataframe. If this condition fails, you will get an error.
df["1"] = [6, 7, 8]

df.head()
If everything went well, you don’t have to rename the columns in the DataFrame now. If not, check that post out! After reading your data from a CSV file, renaming the column, and adding a new column, you also may need to change your data types to numeric. Check out the newer post, about this topic, to learn more about converting columns in Python.
Append a Column to Pandas Dataframe Example 2:
In this example, you learn how to create a dataframe and add a new column that has a default value for each of the rows in the dataframe.
df["3"] = "Python Daddy"

df.head()
Append a Column to Pandas Datframe Example 3:
In the third example, you will learn how to append a column to a Pandas dataframe from another dataframe. This can be done in a similar way as before but you can also use the DataFrame.merge() method. First, however, you need to have the two Pandas dataframes:
data1 = {"Wine":[
    "Pinot Noir",
    "Sauvignon Blanc",
    "Pinot Grigio",
    "Chardonnay"],
        "Rating":[
            3,
            2,
            4,
            3,
        ]}


data2 = {"Wine":[
    "Pinot Noir",
    "Sauvignon Blanc",
    "Pinot Grigio",
    "Chardonnay"],
        "Intensity":[
            1,
            2,
            3,
            1,
        ]}

df1 = pd.DataFrame(data1)
df2 = pd.DataFrame(data2)
Now, you can index (and name) the new column “Intensity” (in df1, in this example). Second, you use the same index, but from df2, as the values:
Second, if we wanted to append more than one column we can use the df.merge() method.
Now, you know how to append a column to a Python dataframe. Furthermore, you know how to append many columns by using the merge() method. Now that you have your data you may want to visualize it using Python with the Seaborn barplot() method.


